
ASIC mining uses purpose-built chips to calculate one proof-of-work algorithm at very high speed, but hashrate alone says little about operating performance. A 200 TH/s Bitcoin miner drawing 3,500 W uses 84 kWh every 24 hours and operates at 17.5 J/TH. At $0.07/kWh, electricity costs $5.88 per day before pool fees, cooling, maintenance, and downtime. A mining guide helps connect machine specifications with pool shares, network difficulty, payout methods, and accepted hashrate. In 2024, Bitcoin’s block subsidy fell from 6.25 BTC to 3.125 BTC, making power efficiency and fee income more important when comparing ASIC setups.
An ASIC, or Application-Specific Integrated Circuit, is made for a narrow computing task. Bitcoin ASICs calculate SHA-256 hashes rather than handling the broad workloads expected from CPUs and GPUs. A machine rated at 200 TH/s attempts roughly 200 trillion hashes each second, while a 100 TH/s unit performs about half as many attempts under comparable conditions. The difference matters only after electricity use is included, which leads naturally from raw speed to efficiency.
Efficiency is commonly measured in joules per terahash. A 200 TH/s miner consuming 3,500 W works at 17.5 J/TH, while a 200 TH/s machine drawing 5,000 W reaches 25 J/TH. Both provide the same nominal hashrate, yet the second uses about 42.9% more electricity. Over a 30-day month, consumption rises from 2,520 kWh to 3,600 kWh, so a guide that explains J/TH gives a more useful comparison than a product page showing TH/s alone.
That efficiency gap becomes an operating expense as soon as the ASIC runs continuously. At $0.06/kWh, 2,520 kWh costs $151.20 per month, compared with $216 for 3,600 kWh. Across 100 machines, the difference reaches $6,480 per month before ventilation, repairs, networking, facility costs, or pool charges. A one-cent change in electricity price costs an extra $25.20 per month for every ASIC consuming 84 kWh per day. Power pricing therefore connects hardware selection with the economics shown in a mining guide.
| Example ASIC | Hashrate | Power | Efficiency | 30-Day Energy |
|---|---|---|---|---|
| Miner A | 150 TH/s | 3,000 W | 20 J/TH | 2,160 kWh |
| Miner B | 200 TH/s | 3,500 W | 17.5 J/TH | 2,520 kWh |
| Miner C | 220 TH/s | 4,400 W | 20 J/TH | 3,168 kWh |
The table also explains why a larger TH/s number does not automatically produce a better operating result. Miner C supplies 10% more hashrate than Miner B but consumes about 25.7% more power. An operator paying $0.08/kWh spends roughly $253.44 per 30 days on Miner C versus $201.60 on Miner B. Once machine efficiency is understood, the next question is how that computational work reaches the Bitcoin network through a pool.
A mining pool combines work from many independent ASICs. Instead of waiting for one machine to find a block by itself, participants submit shares that demonstrate completed hashing work. Shares are easier to find than a network-valid Bitcoin block because the pool assigns a lower share-difficulty target. The pool records accepted work and applies its stated payout method, allowing a miner with a small percentage of pool hashrate to receive more regular payments than solo mining would normally provide.
A share is not a Bitcoin block. It is a measurable unit of work submitted to a pool. A network-valid block must satisfy Bitcoin’s network difficulty, while a pool share only needs to satisfy the pool’s assigned target.
That distinction makes pool statistics easier to read. A local ASIC interface might report 200 TH/s while the pool shows 193 TH/s over a selected period. The difference is 3.5%, but a short observation period can naturally produce uneven share submissions. A persistent difference across 24 hours deserves more attention because rejected shares, connection interruptions, thermal limits, unstable power, or hardware faults can reduce accepted work. Pool-side measurements therefore add a second performance record beside the miner’s own dashboard.
The ViaBTC BTC Mining Pool provides pool-side information that can be used alongside an ASIC’s local readings. A beginner can compare worker activity, hashrate reporting, pool status, and mining records rather than assuming that the number displayed by the machine equals accepted pool work. If a 200 TH/s ASIC averages 190 TH/s at the pool over a sufficiently long period, the 5% difference gives the operator a measurable reason to inspect configuration, connectivity, temperature, and rejected-share data.
Worker accounts make that inspection easier when more machines are added. A facility with 40 ASICs rated at 200 TH/s has 8 PH/s of nominal capacity. If one worker stops submitting entirely, reported capacity can fall by about 2.5%; if four stop, roughly 10% of nominal capacity disappears. Clear worker names allow an operator to identify the affected units without checking every physical machine, connecting pool monitoring with maintenance work.
Network conditions add another layer because an ASIC does not mine against a fixed amount of competition. Bitcoin adjusts mining difficulty every 2,016 blocks, approximately every two weeks when blocks average close to 10 minutes. If total competing hashrate rises while one miner stays at 200 TH/s, that miner represents a smaller share of network work. A mining guide that explains difficulty helps users understand why identical hardware can produce different BTC amounts across separate months.
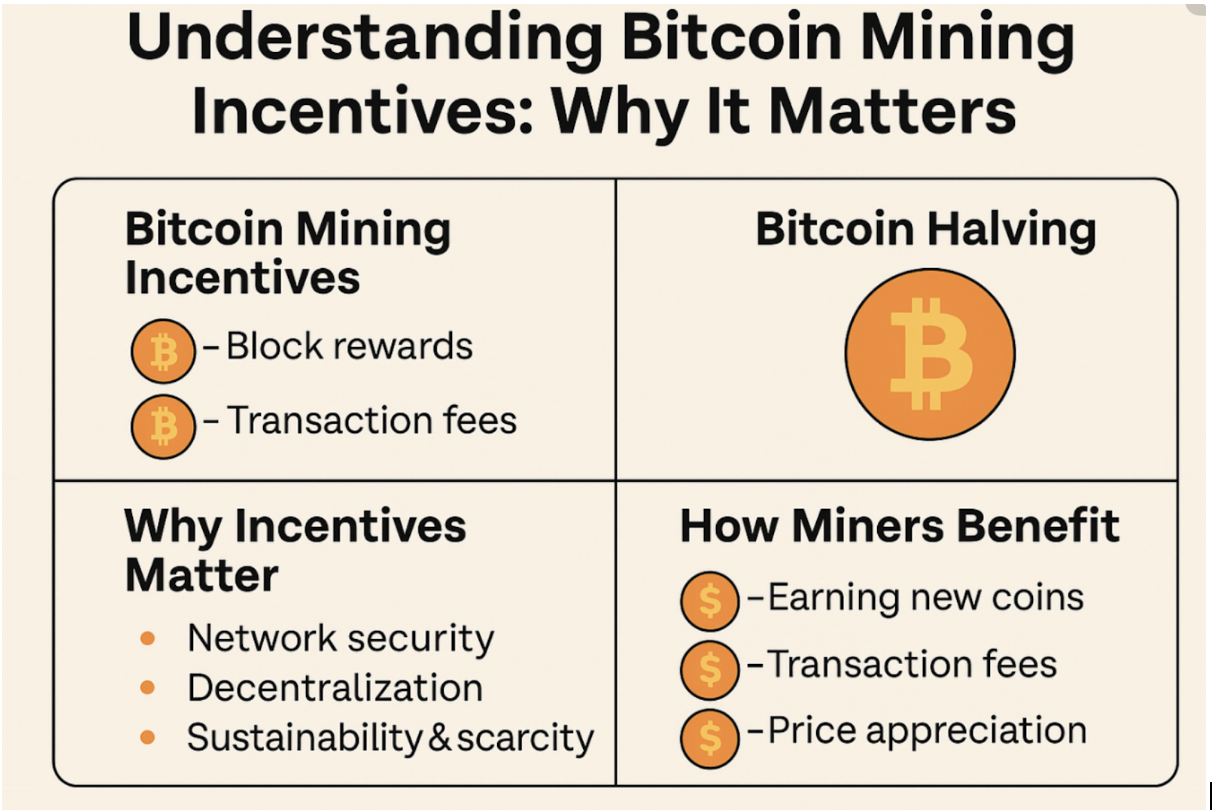
The 2024 Bitcoin halving provides a clear example of protocol-level change. At block 840,000, the block subsidy fell 50%, from 6.25 BTC to 3.125 BTC. A miner operating before and after that event could keep the same 200 TH/s machine, power draw, firmware, and internet connection while facing a substantially different reward environment. Transaction fees remain part of block rewards, so actual miner revenue cannot be estimated from the subsidy alone.
Bitcoin mining income depends on more than machine speed: block subsidy, transaction fees, network difficulty, pool rules, accepted work, uptime, and market price all affect the amount or monetary worth received.
Pool payout methods add another difference between displayed hashrate and actual payments. Methods such as PPS, PPLNS, and related variants distribute mining proceeds differently, particularly in how block-finding variance and transaction-fee components are handled. A miner should read the pool’s current payout definitions and fee schedule rather than assume that two pools paying against the same 200 TH/s will produce identical credited amounts. Even a 1% difference matters when applied repeatedly across a large fleet.
Consider a hypothetical facility with 100 ASICs, each drawing 3.5 kW. The miners alone require 350 kW while running, or 8,400 kWh per day. At $0.05/kWh, miner electricity costs $420 daily; at $0.08/kWh, it becomes $672, a 60% increase. Over 30 days, the difference is $7,560. Facility ventilation, cooling equipment, transformers, networking, lighting, and other electrical consumption can increase total metered usage beyond the ASIC nameplate figures.
Heat follows the same electrical scale. Most electricity consumed by an ASIC eventually appears as heat in the mining space. A 3.5 kW unit therefore requires the facility to handle roughly 3.5 kW of continuous heat output; 100 comparable units approach 350 kW before other equipment is counted. A guide focused only on pool setup would be incomplete for anyone planning more than a few machines, because sustained hashing depends on acceptable inlet temperatures and reliable airflow.
Uptime deserves similar attention. A machine available 99% of a 30-day month is unavailable for about 7.2 hours; at 95% availability, lost time reaches about 36 hours. For a 200 TH/s ASIC, the difference between 99% and 95% availability represents roughly 192 TH-hours of nominal computing time per month. Hardware efficiency cannot compensate for long periods when the worker is offline, so pool worker records are useful for spotting repeated disconnects.
Rejected work also deserves measurement rather than guesswork. If a worker submits 100,000 shares and 1,500 are rejected, its observed rejection rate is 1.5%. Another machine submitting the same 100,000 shares with 300 rejected records 0.3%. The first unit loses a larger portion of submitted work and should be checked for network latency, configuration, frequency settings, or instability. Comparing several workers under the same facility conditions can help separate a machine-specific issue from a site-wide connection problem.
Profit calculations become more realistic after hashrate, uptime, and accepted work are considered together. Suppose a 3.5 kW ASIC records $8.50 in daily mining revenue under one set of network and market conditions. Electricity at $0.06/kWh costs $5.04 per day, leaving $3.46 before pool fees, facility power, repairs, equipment cost, taxes, and other expenses. At $0.09/kWh, miner electricity alone reaches $7.56, leaving only $0.94 before the remaining expenses.
A purchase-price calculation adds another dimension. If an ASIC costs $4,000 and produces an illustrative $3.46 per day after miner electricity but before other expenses, dividing $4,000 by $3.46 gives about 1,156 days. That simple calculation assumes unchanged revenue for more than three years, an assumption that ignores future difficulty adjustments, BTC price changes, downtime, repairs, and later halvings. Scenario ranges are therefore more useful than one fixed payback number.
-
At 100% of an assumed revenue level, record expected monthly revenue and electricity.
-
At 80% of that revenue, recalculate the remaining amount without reducing power use by the same 20%.
-
At a 10% increase in electricity price, calculate the new 30-day energy expense.
-
At 95% uptime, reduce expected hashing time by about 36 hours per 30-day month.
-
For a fleet, repeat the calculation using facility-level metered power rather than ASIC nameplate power alone.
Those scenarios show why ASIC comparisons need consistent measurement periods. Comparing one miner’s five-minute local hashrate with another miner’s 24-hour pool average can produce a misleading ranking. A fair comparison uses similar averaging windows, accepted pool hashrate, measured wall power, identical electricity pricing, and similar operating temperatures. Testing 10 machines of the same model also provides more information about unit-to-unit variation than relying on one sample.
Hardware age should be considered with the same discipline. An older ASIC may still hash reliably in 2026, but a newer model with substantially lower J/TH can spend less on electricity for the same amount of work. If two 200 TH/s machines operate at 30 J/TH and 17.5 J/TH, their power requirements are approximately 6,000 W and 3,500 W. The older-efficiency example consumes about 71.4% more electricity for equal nominal hashrate.
The ViaBTC mining guide can therefore be read as more than a connection tutorial. It gives users the terminology needed to relate ASIC specifications to worker statistics, submitted shares, reward accounting, and network conditions. Hashrate should be read together with J/TH, accepted shares, uptime, difficulty, payout terms, and actual metered electricity. With those measurements recorded over consistent periods, a 200 TH/s specification becomes an operating number that can be checked against 24-hour pool performance and 30-day costs.